

Facebook Ads Usage Among Vacation Rental Companies
How many vacation rental companies are actually running Facebook (Meta) ads? We checked 541 companies to find out — and the results reveal a significant gap between adopters and non-adopters.
We analyzed Meta Ads usage for 541 vacation rental companies in Nearsight's database to determine how many are currently running paid ads, and in what volume.
Quick note: For those of you who aren't familiar with Meta Ads, they are a paid advertising platform offered by Meta (formerly Facebook) that allows businesses to create and run ads on Facebook, Instagram, and other Meta properties.
According to a study performed by Pew Research Center, 71% of American adults use Facebook and 50% use Instagram — with roughly half of U.S. adults visiting Facebook daily[1]. That represents a massive audience for vacation rental companies looking to reach potential guests and owners.
Yet despite that reach, our research found that only 37% of vacation rental companies (200 out of 541) are currently running Meta ads. The remaining 63% have no active ads in the Meta Ad Library — leaving a significant advertising channel largely untapped by the majority of the industry.
Among those running ads, the average company has 7 active ads, though the median is just 5 — indicating a right-skewed distribution where a small group of heavy advertisers pulls the average up. The majority (57%) are running 5 or fewer ads.
The top advertisers are running up to 30 active ads simultaneously, with companies like The Sea Pines Resort, The Vacation Company, and Wander leading the pack.
Key Findings
Only 37% of vacation rental companies are currently running Meta ads — 63% have zero active ads
The average company runs 7 active ads, but the median is only 5 — a right-skewed distribution
57% of advertisers are running 5 or fewer active ads at any given time
The top company is running 30 active ads simultaneously — 4x the industry average
1,401 total active ads are running across all 200 companies — an average of 7 each
Only 12.5% of advertisers have inactive ads alongside active ones — most run only active campaigns
Only 19% of advertisers are running more than 10 active ads — heavy advertising is uncommon
3 companies have historical ads but are not currently running any — potential seasonal advertisers
Meta Ads Adoption Rate
Of the 541 vacation rental companies we checked, 200 (37%) are currently running at least one active Meta ad. The remaining 341 companies (63%) have no active ads in the Meta Ad Library.
This suggests that the majority of vacation rental companies are not leveraging paid Meta advertising as part of their marketing strategy — presenting a significant opportunity for those who do invest in it.
How Many Ads Are Companies Running?
Among the 200 companies actively running Meta ads, the distribution of active ad counts skews toward lower numbers. The largest group (41%) is running between 2 and 5 active ads, while 16% are running just a single ad.
Only 19% of advertisers are running more than 10 active ads at any given time, and just 8% are running 21 or more. This indicates that most vacation rental companies take a conservative approach to ad volume.
Observations
- The 2-5 ads bucket dominates: 82 companies (41%) fall in this range, suggesting most companies maintain a small but active ad portfolio.
- Single-ad advertisers are common: 32 companies (16%) are running just one ad — potentially testing the waters or running an always-on brand awareness campaign.
- Heavy advertisers are the minority: Only 16 companies (8%) run 21-30 ads, representing the most aggressive Meta advertising strategies in the industry.
Statistical Overview
| Average | 7.00 active ads |
| Median | 5 active ads |
| Minimum | 1 |
| Maximum | 30 |
| Std. Deviation | 7.04 |
| Total Active Ads | 1,401 |
Active vs. Inactive Ads
Across the 200 companies running Meta ads, we found a total of 1,519 ads in the Meta Ad Library — 1,401 active and 118 inactive.
The overwhelming majority of ads (92.2%) are active, suggesting that most companies are keeping their ad libraries clean and not accumulating large numbers of paused or expired creatives. Only 25 of 200 companies (12.5%) have any inactive ads alongside their active campaigns.
Top 10 Companies by Active Ads
The table below shows the 10 most active Meta advertisers in our dataset. These companies are running between 26 and 30 active ads — significantly above the industry average of 7.
Notably, several of these top advertisers also maintain a notable number of total ads (active + inactive), with Wander having the highest total at 50 ads and FunVacay close behind at 49 — suggesting these companies are regularly testing and rotating creative.
| Rank↑ | Company | Active Ads↕ | Inactive Ads↕ | Total Ads↕ |
|---|---|---|---|---|
| 1 | The Sea Pines Resort | 30 | 0 | 30 |
| 2 | The Vacation Company | 30 | 0 | 47 |
| 3 | Cabins for You | 29 | 0 | 29 |
| 4 | Carolina One Vacation Rentals | 29 | 1 | 36 |
| 5 | Condo-World | 29 | 0 | 29 |
| 6 | Marco Island Vacation Properties | 29 | 0 | 29 |
| 7 | Wander | 29 | 1 | 50 |
| 8 | Margaret Rudd & Associates Inc | 28 | 0 | 28 |
| 9 | Resort Realty | 27 | 0 | 27 |
| 10 | FunVacay | 26 | 4 | 49 |
See Which Ads Your Competitors Are Running
Nearsight gives you the ability to monitor the Meta ads your competitors are running — including ad creative, launch timing, platform distribution, and landing page insights — all from a single dashboard.
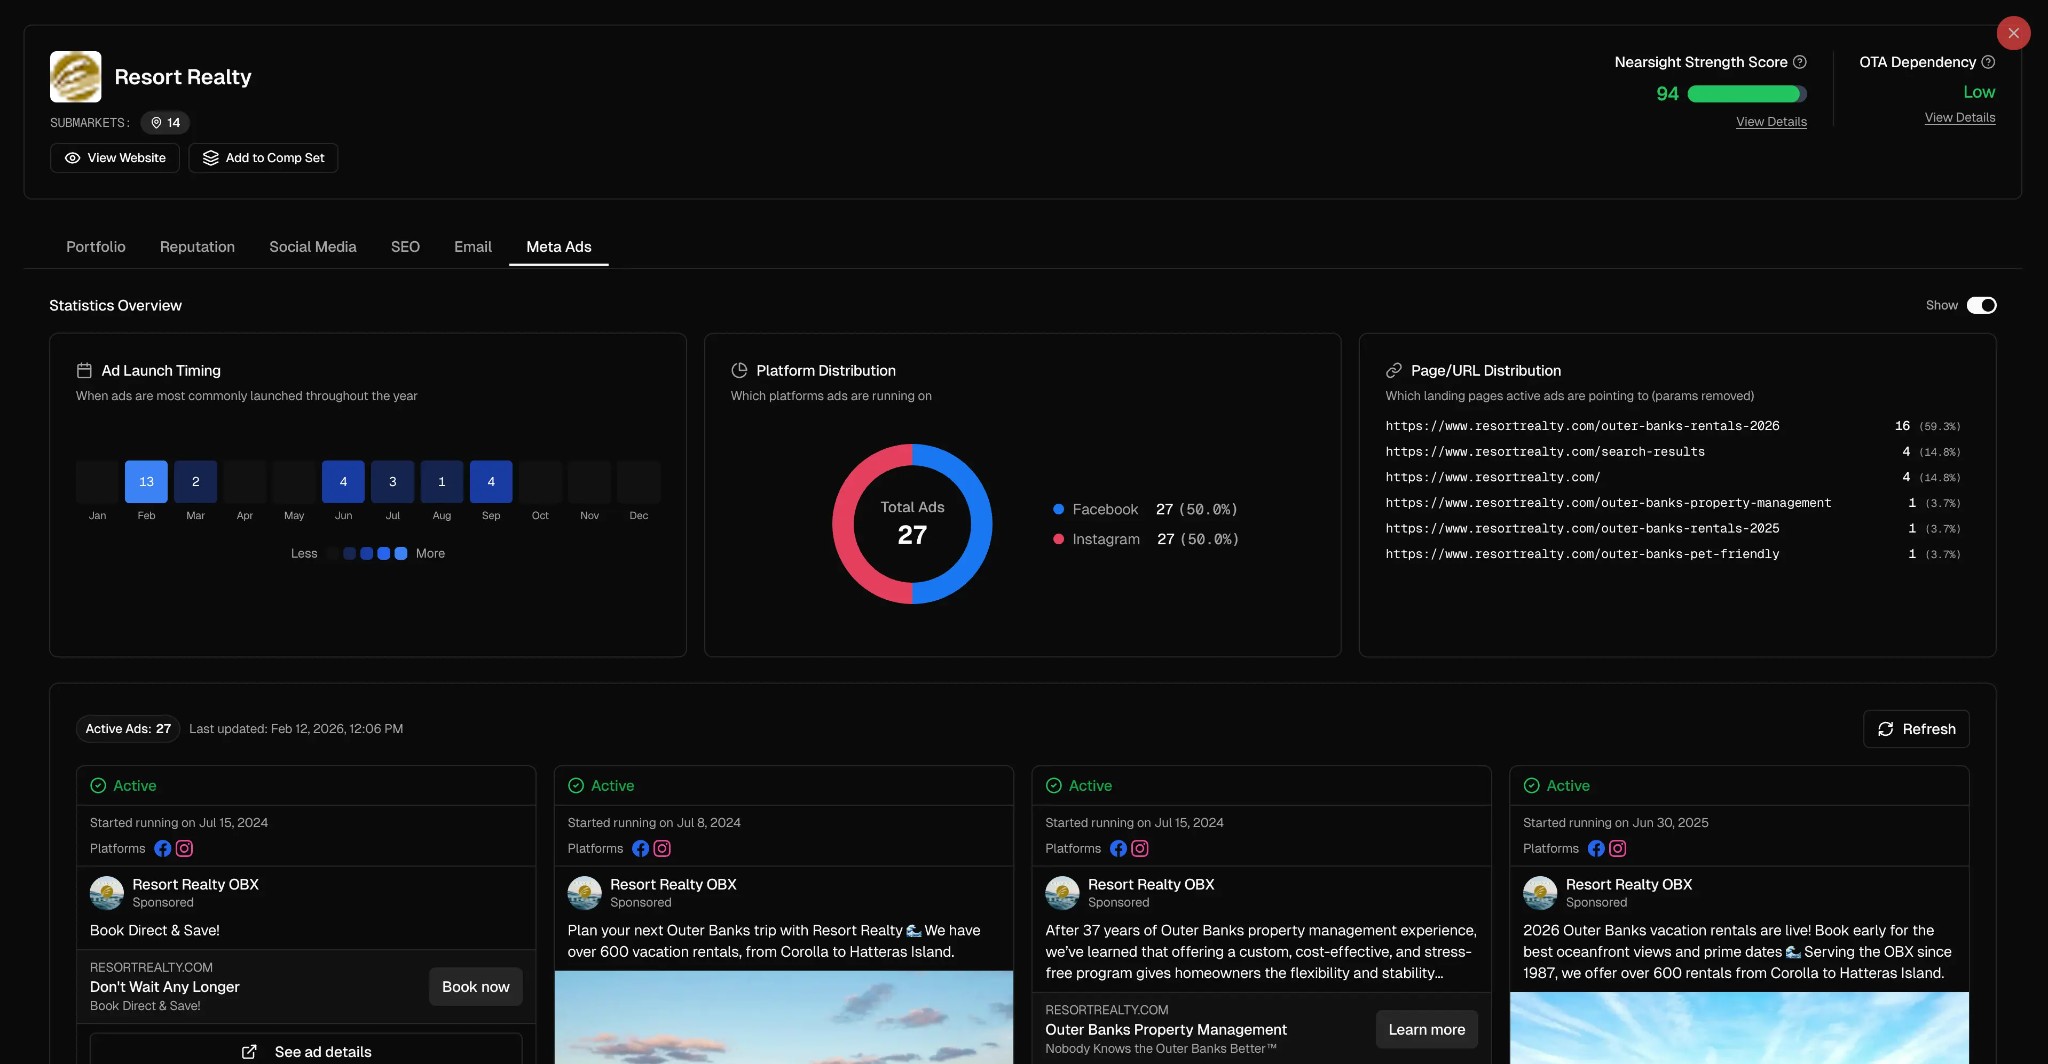
Screenshot: Nearsight's Meta Ads tab on a competitor profile, showing Resort Realty's active ads, ad launch timing, platform breakdown, and top landing pages.
Future Additions
This study is a starting point. We plan to expand and refine this research over time with deeper analysis, including:
- Platform distribution — Understanding where companies are allocating their ad spend across Facebook, Instagram, Messenger, and Audience Network.
- Seasonal and timing trends — Identifying when vacation rental companies ramp up or scale back their ad activity throughout the year.
- Guest vs. homeowner targeting — Exploring how many companies are using Meta ads to attract guests versus recruiting property owners to their management portfolio.
- Real-world ad examples — Highlighting standout creative from companies doing it well, with commentary on what makes their ads effective.
Make sure to bookmark this page, we're going to be updating it as new data and insights become available.
Data Sourcing & Limitations
Data Sourcing
Ad data was collected using Meta Ad Library and Nearsight's vacation rental company database on February 11, 2026.
For each company, we retrieved all ads (active and inactive) from the Meta Ad Library and classified them based on their current status.
Limitations
- Point-in-time snapshot — Ad data reflects a single point in time (February 11, 2026). Companies may start or stop ads at any time.
- US-focused sample — Results may not generalize to international vacation rental markets.
- Selection bias — Our dataset represents companies in Nearsight's database, not the entire vacation rental industry.
- Ad visibility differences — In rare cases (less than 1% of the dataset based on our internal testing), the Meta Ad Library may show slightly different results depending on how it is accessed. This can cause a small number of active ads to be misclassified.
Sources
- Gottfried, J. & Park, E. (2025). "Americans' Social Media Use 2025." Pew Research Center. https://www.pewresearch.org/internet/2025/11/20/americans-social-media-use-2025/
Intelligence that drives growth.
Track what your competitors are doing—from portfolio changes to marketing campaigns—and use those insights to grow your business.